.svg)


.png)
Much of the market commentary on ETFs has focused on headline winners, triple-digit returns, and rapid growth in ETF adoption, however, signs point to a more nuanced reality for Australian investors.
While several sectors posted strong median gains, many still lagged their market benchmarks, according to Rainmaker Information’s Wholesale Managed Fund Performance Tables.
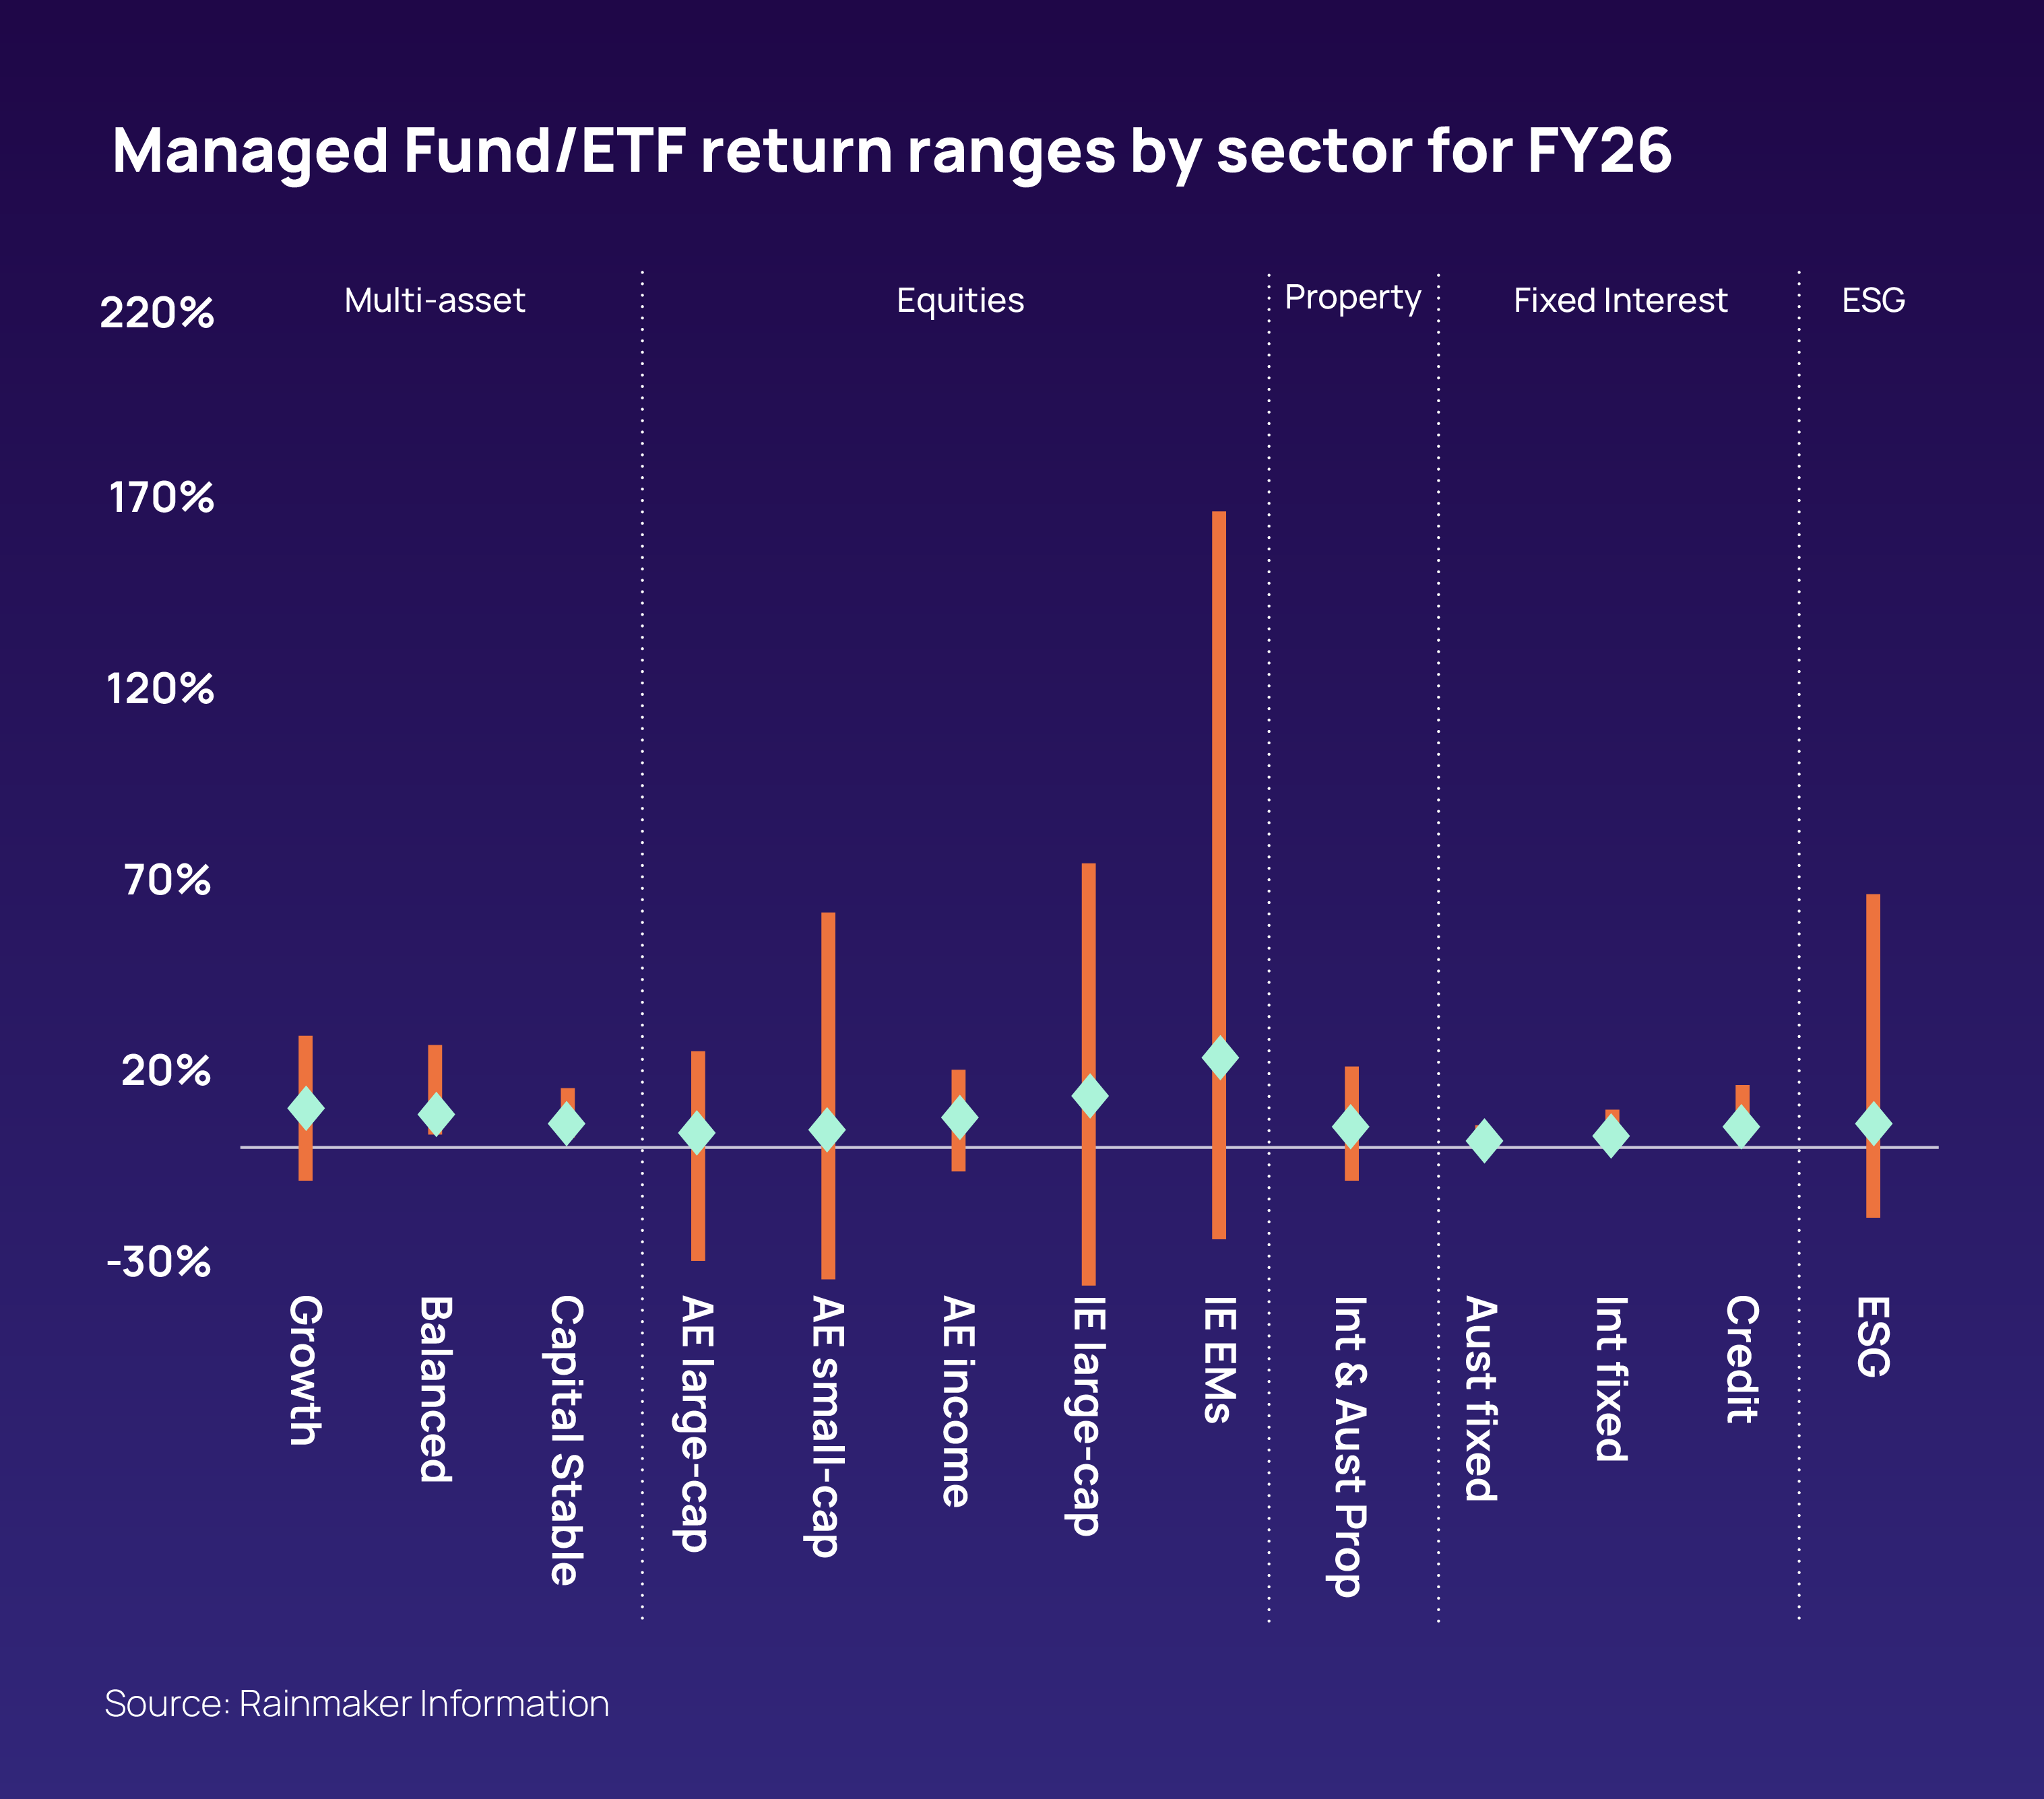
The median large-cap Australian Equities managed fund returned 4.1%, compared to 6.1% for the S&P/ASX 200 Index, while outcomes for the top quartile of funds ranged from 7.2% to 25.4%.
“We analysed outcomes for 125 large-cap Australian equity funds, and nearly one third of funds outperformed the index,” said Dr. Camille Schmidt, associate director of research at Rainmaker Information.
A similar pattern appeared in small-cap Australian equities, which are historically viewed as a key area for active outperformance.
The median fund returned 5.0% versus 8.1% for the S&P/ASX Small Ordinaries Index, and only 23 of 55 funds beat the index.
Emerging market funds, the sector with the strongest median return, was the only sector where the top-quartile managers consistently matched or beat index outcomes.
In combined property, returns diverged between domestic and offshore exposures.
The S&P/ASX 200 A-REIT index fell 2.2%, and most domestic property-focused funds produced similar outcomes.
“Many global property funds delivered 15.0% or more, with strength in the Australian dollar acting as a headwind for unhedged offshore positions, while hedged or partially hedged exposures helped cushion the currency impact,” said Dr. Schmidt.
The performance gap also reflected stronger returns from globally listed property markets, particularly in specialised real estate sectors.
ESG fund performance
The median for the ESG sector was 6.0%, however beneath the headline figure, performance varied widely, with the top quartile of funds achieving returns between 15.2% and 66.4%, while a number of funds delivered negative returns.
“This dispersion reflects the breadth of strategies captured under the ESG label, spanning diverse asset allocations, regional exposures, investment approaches, and risk profiles,” said Dr. Schmidt.
"In FY26, ESG funds tilted toward higher-beta global growth themes, particularly climate technology and emerging markets which generally outperformed, while more defensive quality, domestic equity and lower-beta ESG strategies lagged."
"Sector screening also played a role. Many ESG strategies exclude or underweight traditional energy and defence companies, which may have created a relative headwind in some cases.”
“Concentration levels, currency translation effects for offshore holdings, and in some cases leverage, also amplified outcomes. Dispersion was therefore driven more by portfolio construction and risk exposures than by ESG classification alone.”
How persistent are the top performers?
At the top of the FY26 table, many of the strongest performers across the universe of funds that Rainmaker Information tracks, were concentrated in higher-beta international equity themes linked to semiconductors, AI, Asia technology, hydrogen and battery materials.
.png)
“The one-year performance data alongside the longer-term view provides useful context,” said Dr. Schmidt.
“Investors should avoid placing undue emphasis on one-year or short-term performance, as the top performers from the past year includes both funds with strong long-term track records and those benefiting from short-term performance spikes.”
Several thematic funds that ranked in the FY26 top 10 ranked substantially lower over three and five-year periods, however some funds did combine strong FY26 results with consistently high longer-term rankings.
iShares MSCI South Korea ETF and Apis Global Long/Short Fund ranked in the top 20 over three, five and ten years.
Perennial Strategic Natural Resources and Global X Ultra Long NDQ 100 Hedge Fund ranked 11th and 13th in FY26 respectively, and also achieved top 20 performance over three- and five-year periods.
Only one Australian equity fund featured among the top 20 performers for FY26, highlighting the dominance of international and thematic strategies during the year.
The UBS Microcap Fund ranked 18th after returning 61.2% and achieved top 20 rankings over both the three and ten-year periods.
“This pattern suggests that, for a number of FY26 leaders, returns reflected favourable timing and thematic rebounds rather than consistently strong long-term outcomes,” said Dr. Schmidt.
“A further qualification is track-record depth. Some funds have incomplete five or 10-year histories, which limits direct comparison across the full group.”
“The broader conclusion is clear - while FY26's top performers included a handful of funds with strong multi-period rankings, others were one-year standouts whose longer-term records were less compelling.”
Future outlook
FY26 will be remembered for surging ETF adoption and strong gains across a number of thematic strategies.
The important message from the June 2026 data is that returns were driven by specific exposures against a backdrop of widening dispersion and uneven benchmark outcomes.
If market conditions shift, future outperformance may depend less on thematic positioning alone and more on how portfolios manage concentration, currency and factor exposures.
Contact our Business Development team to receive further details of Rainmaker's products and services.

Internally managed assets have more than doubled in five years—rising from an estimated $227 billion in 2020 to $550 billion in 2025.

Australian ETP market records $51.9 billion in net flows for 2025, up 60% year-on-year

