Join the Rainmaker Information research team to dissect the year that was and look ahead to how industry trends will shape wealth management in 2026 and beyond.
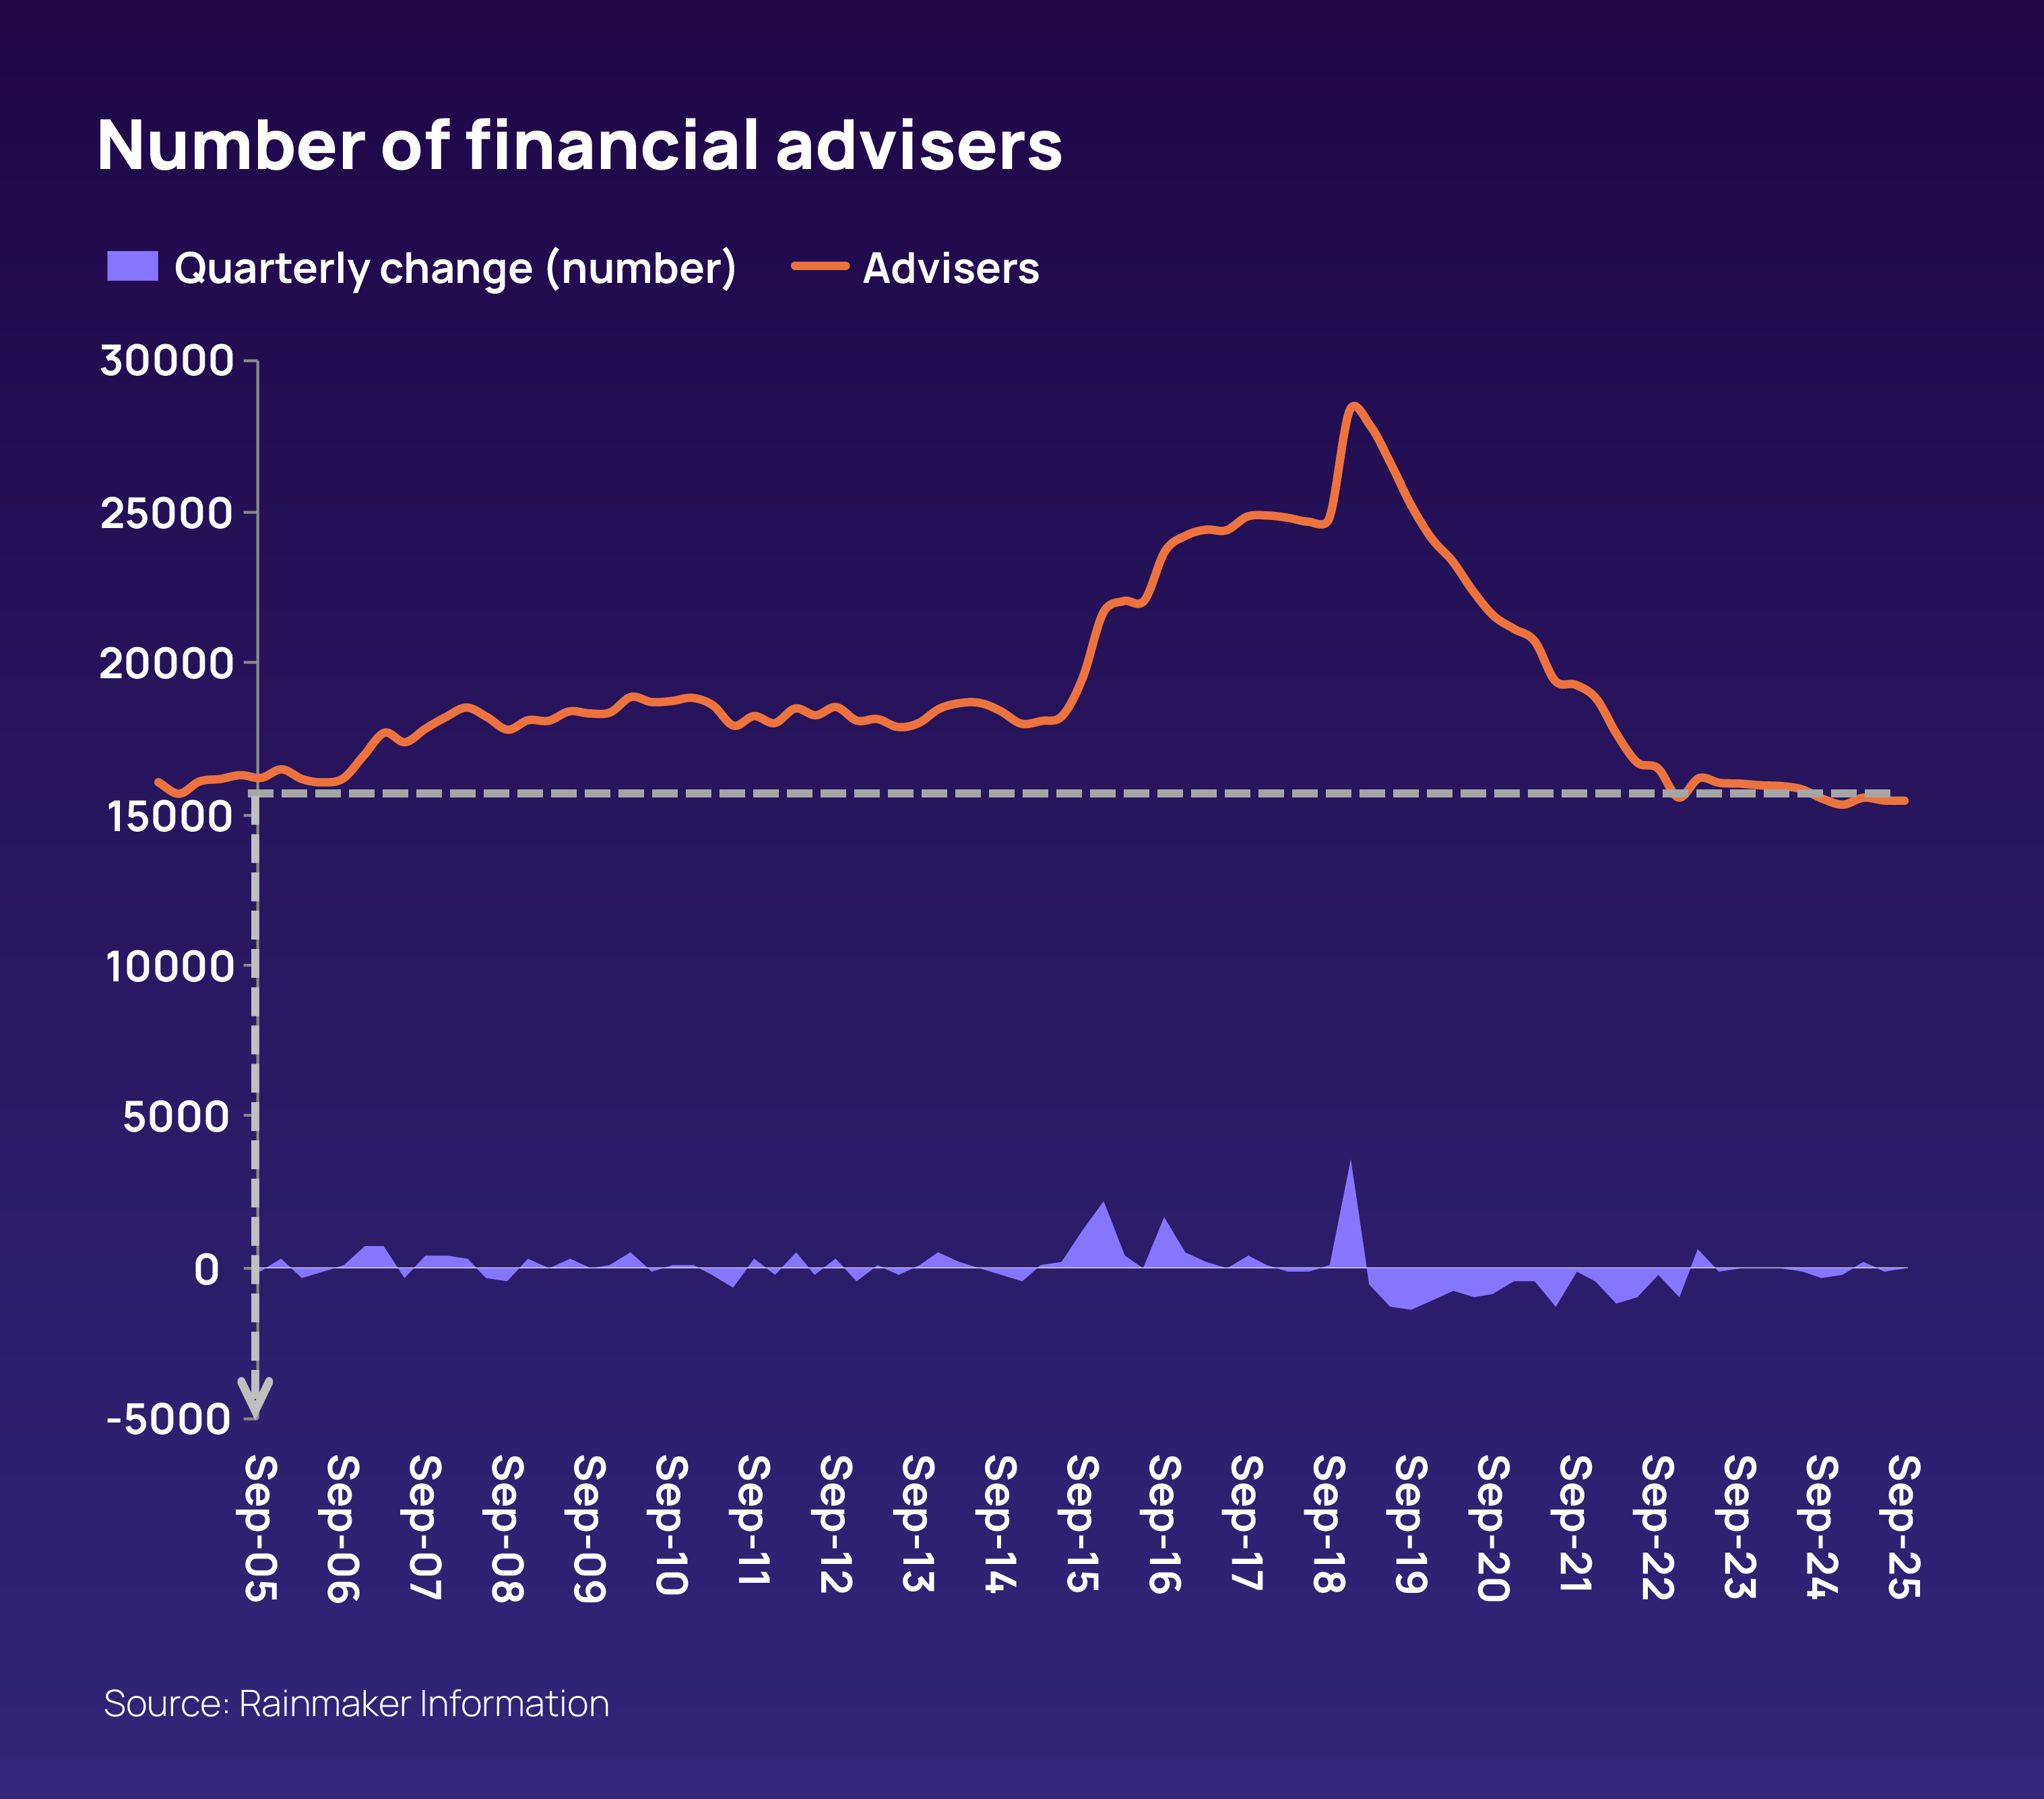
Australia’s wealth management sector has continued to enjoy strong returns, while model portfolios and ETFs continue their surge and superannuation funds lower their fees. Meanwhile financial adviser numbers have stabilised, active management faces challenges and the corporate regulator has remained active across the industry.
Rainmaker Information's research team will focus on how these factors are impacting the wealth management landscape, including financial planning, superannuation, investment management, platforms and insurance markets.
The Australian-sourced (unconsolidated) investment management Funds Under Management (FUM) market was $3.8 trillion at end June 2025, after annual growth of 10.7%.
Consolidated Australian sourced FUM, i.e. net of outsourced FUM, grew slightly higher at 10.9% and was $3.5 trillion.
The June quarter recorded moderate growth as Australian-sourced unconsolidated and consolidated FUM grew 3.3% and 3.5% respectively.
Ten-year rolling annual growth for Australian-sourced FUM was 7.9% pa.
Institutional FUM grew 10.1% while wholesale FUM increased 12.6% during the 12-month period.
Indexed investments grew 16.8% during the 12-month period. This was double the growth of the actively managed investment segment which grew 8.5%.
Sub-advisory FUM grew 1.4% in the June quarter and 7.8% in the 12 months to June 2025.
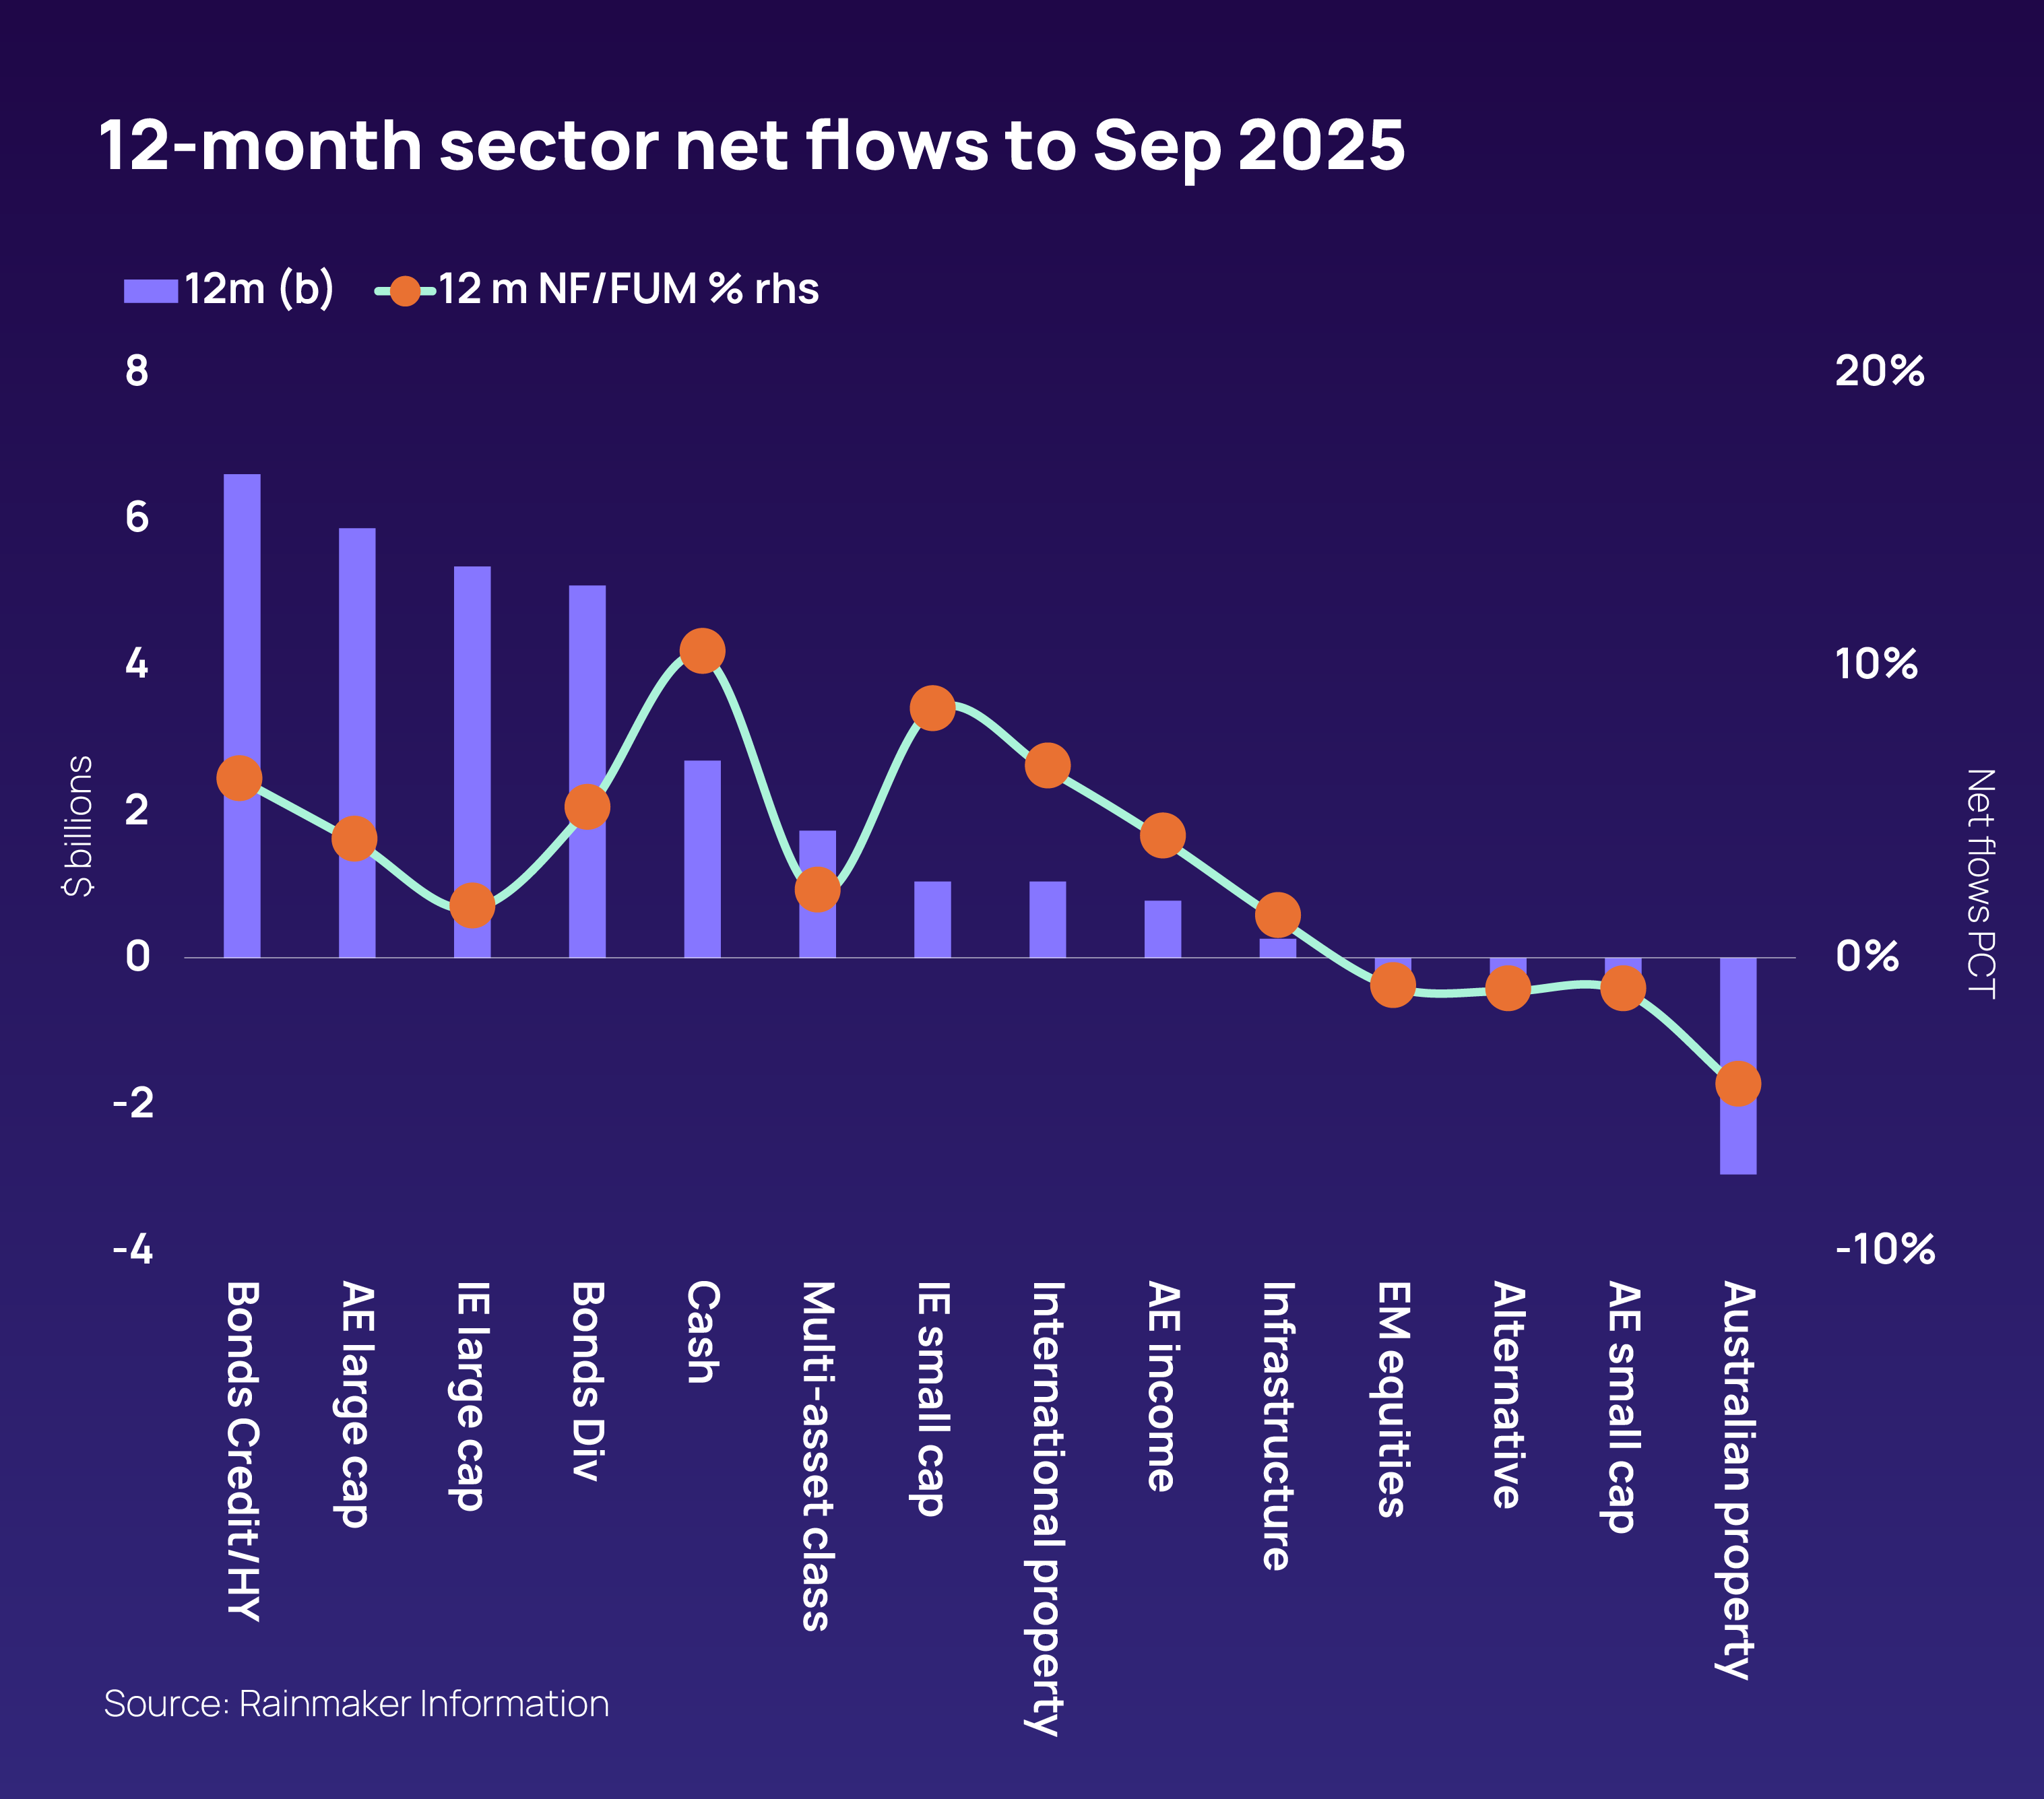
The asset classes had mixed growth in the 12 months to June 2025, as equities and property FUM increased 16.3% and 2.5% respectively while fixed interest and cash fell 1.6% and 8.7%.
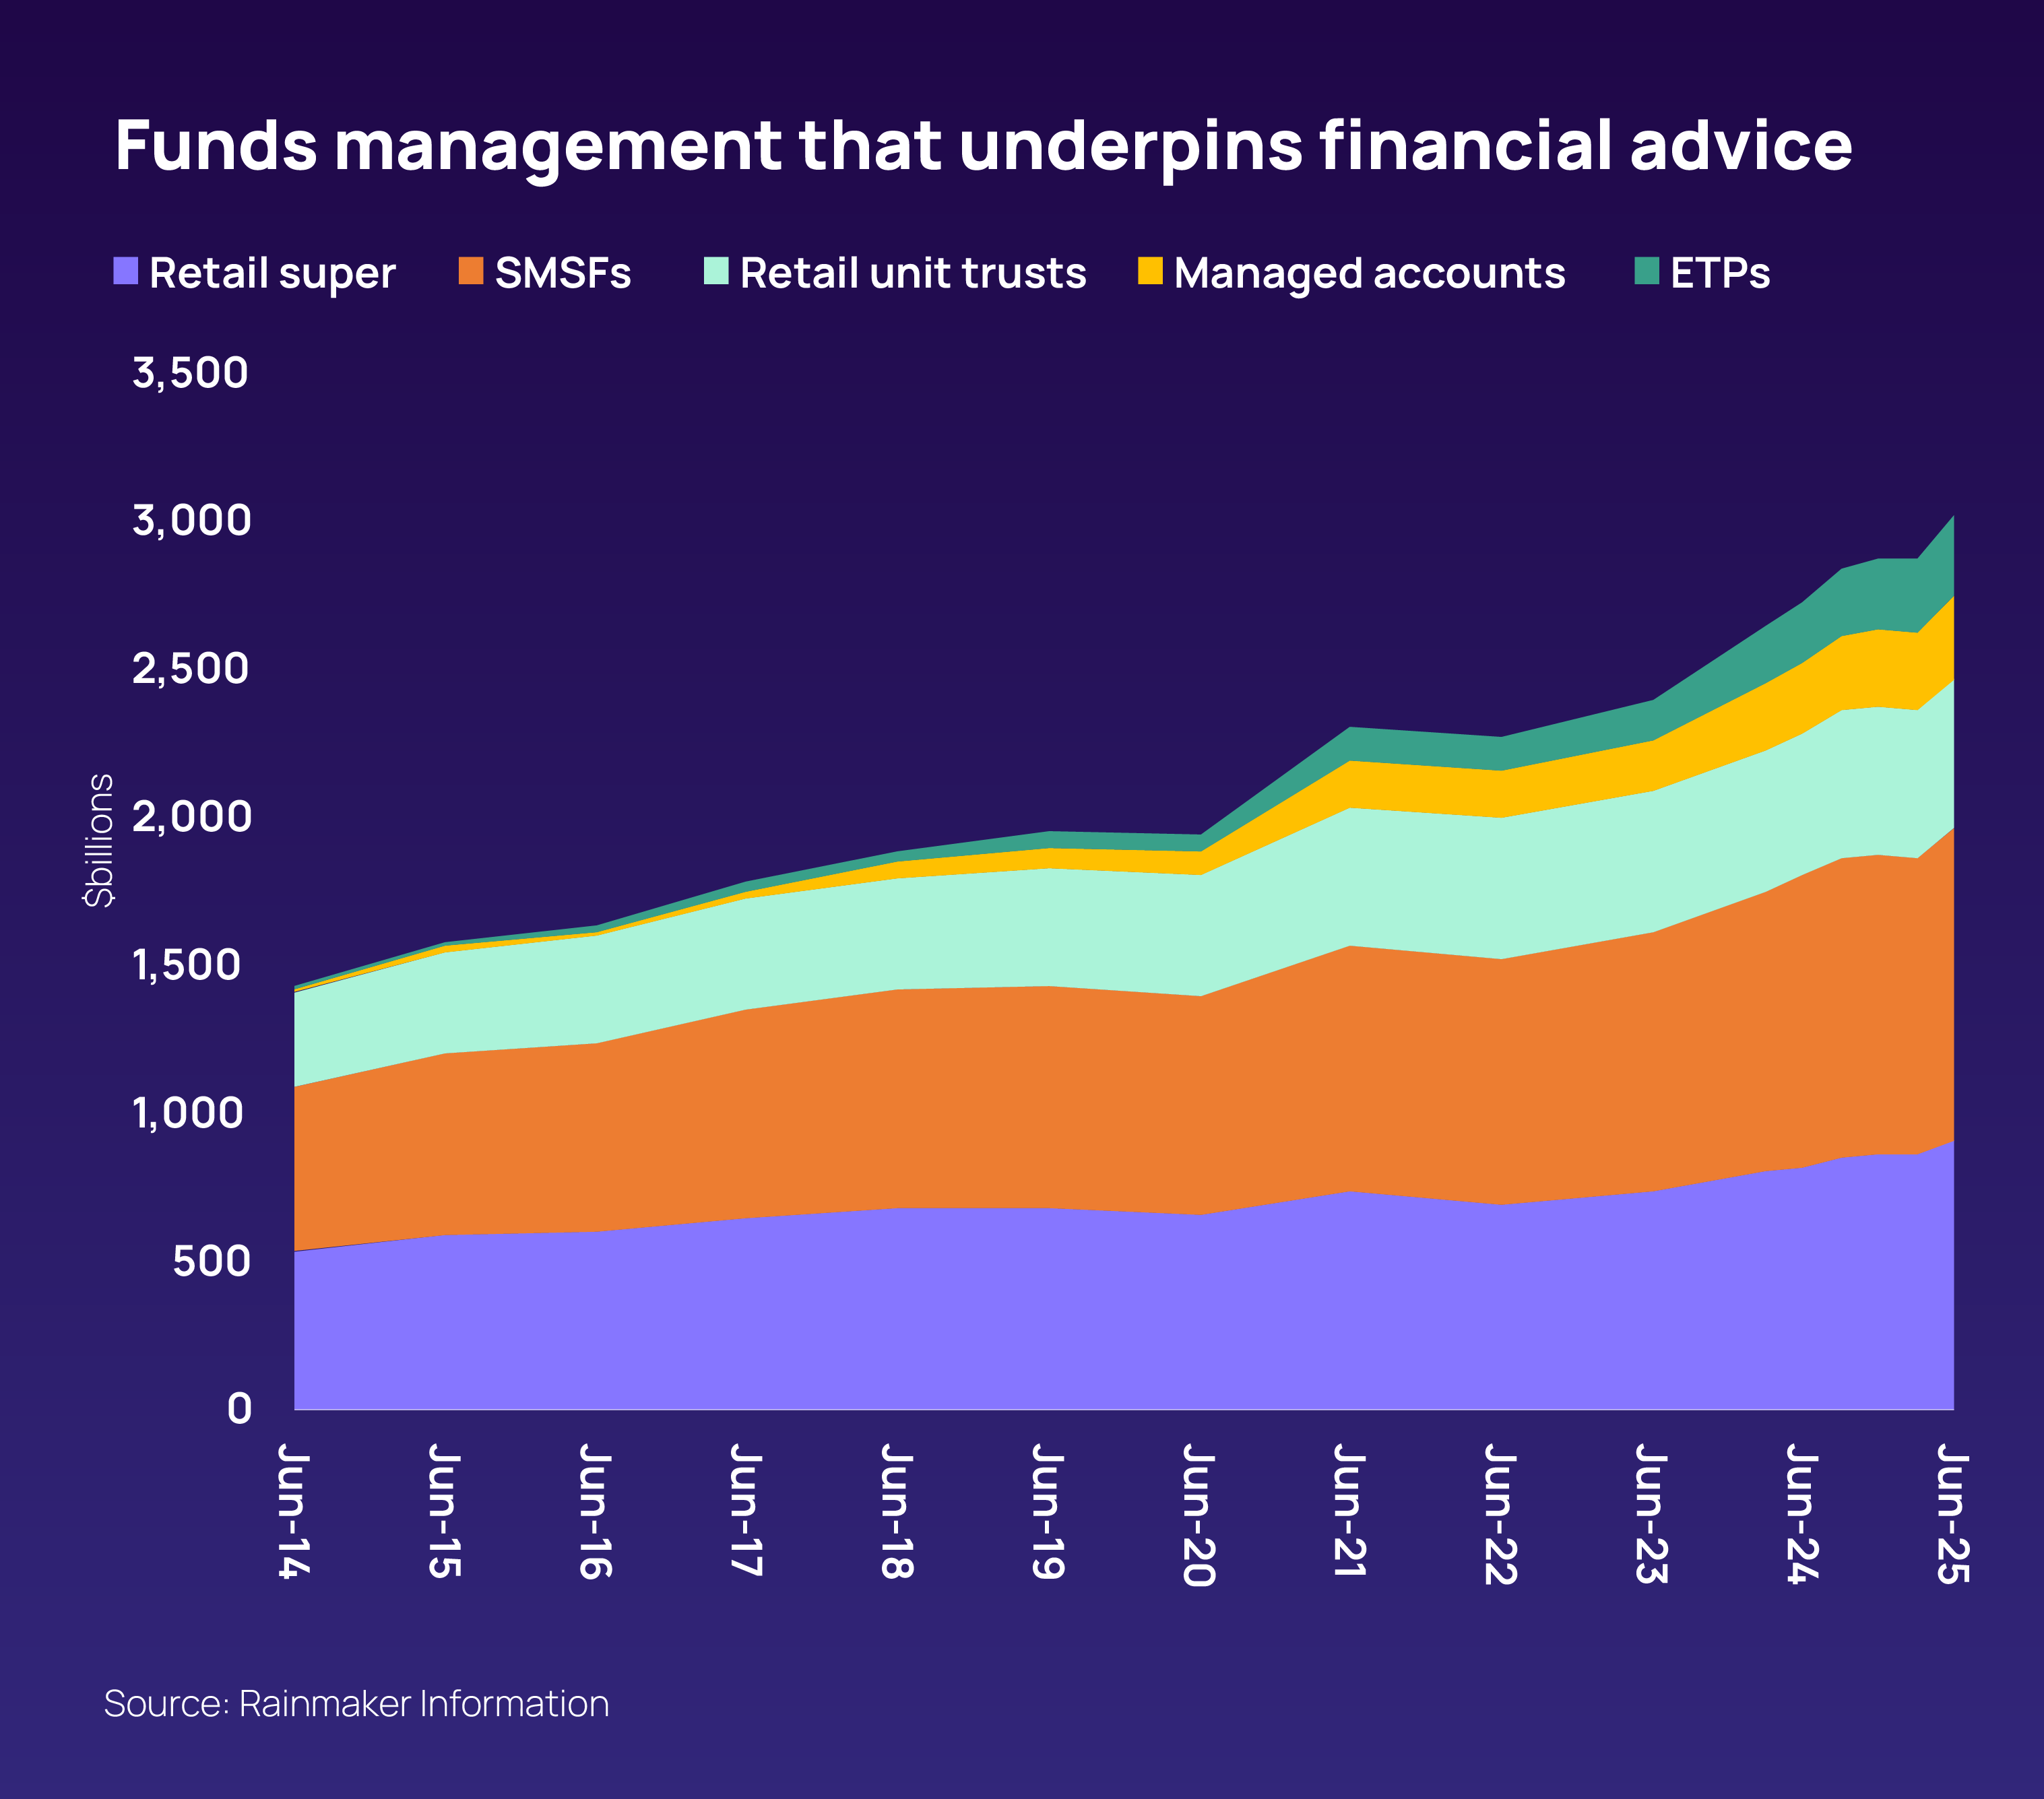
Australia's unconsolidated wholesale funds market reached $2.3 trillion in Funds Under Administration (FUA) . Adding in Term Deposits increases this amount to $3.5 trillion
The wholesale funds market grew 11.1% in the 2024-25 financial year, underpinned by strong growth in managed accounts and Exchange Traded Funds (ETFs).
The wholesale market comprises $1.2 trillion from platforms, $272 billion in ETFs, an estimated $210 billion available in pooled vehicles used by SMSFs, $53 billion in listed investment companies and $800 million in ASX mFunds.
The total platforms FUA grew by 14.8% over the 12-month period, on the back of the investment and retirement segments growing 19.5% and 14.6% respectively. The remaining segment of Super grew by 11.9%.
Platform FUA in master trusts, wraps and selected managed accounts increased 14.8% ($154 billion) over the 12-month period. The June quarter saw a 6.4% expansion.
Investment wraps was the fastest growing segment with 19.5% during the year, followed by retirement super increasing 14.6%. Corporate super grew 12.6% and the lowest growth of 11.2% was in personal super.
Rainmaker estimates that super fund members, including self-managed super fund members, paid an industry aggregate $34 billion in fees in 2024-25.
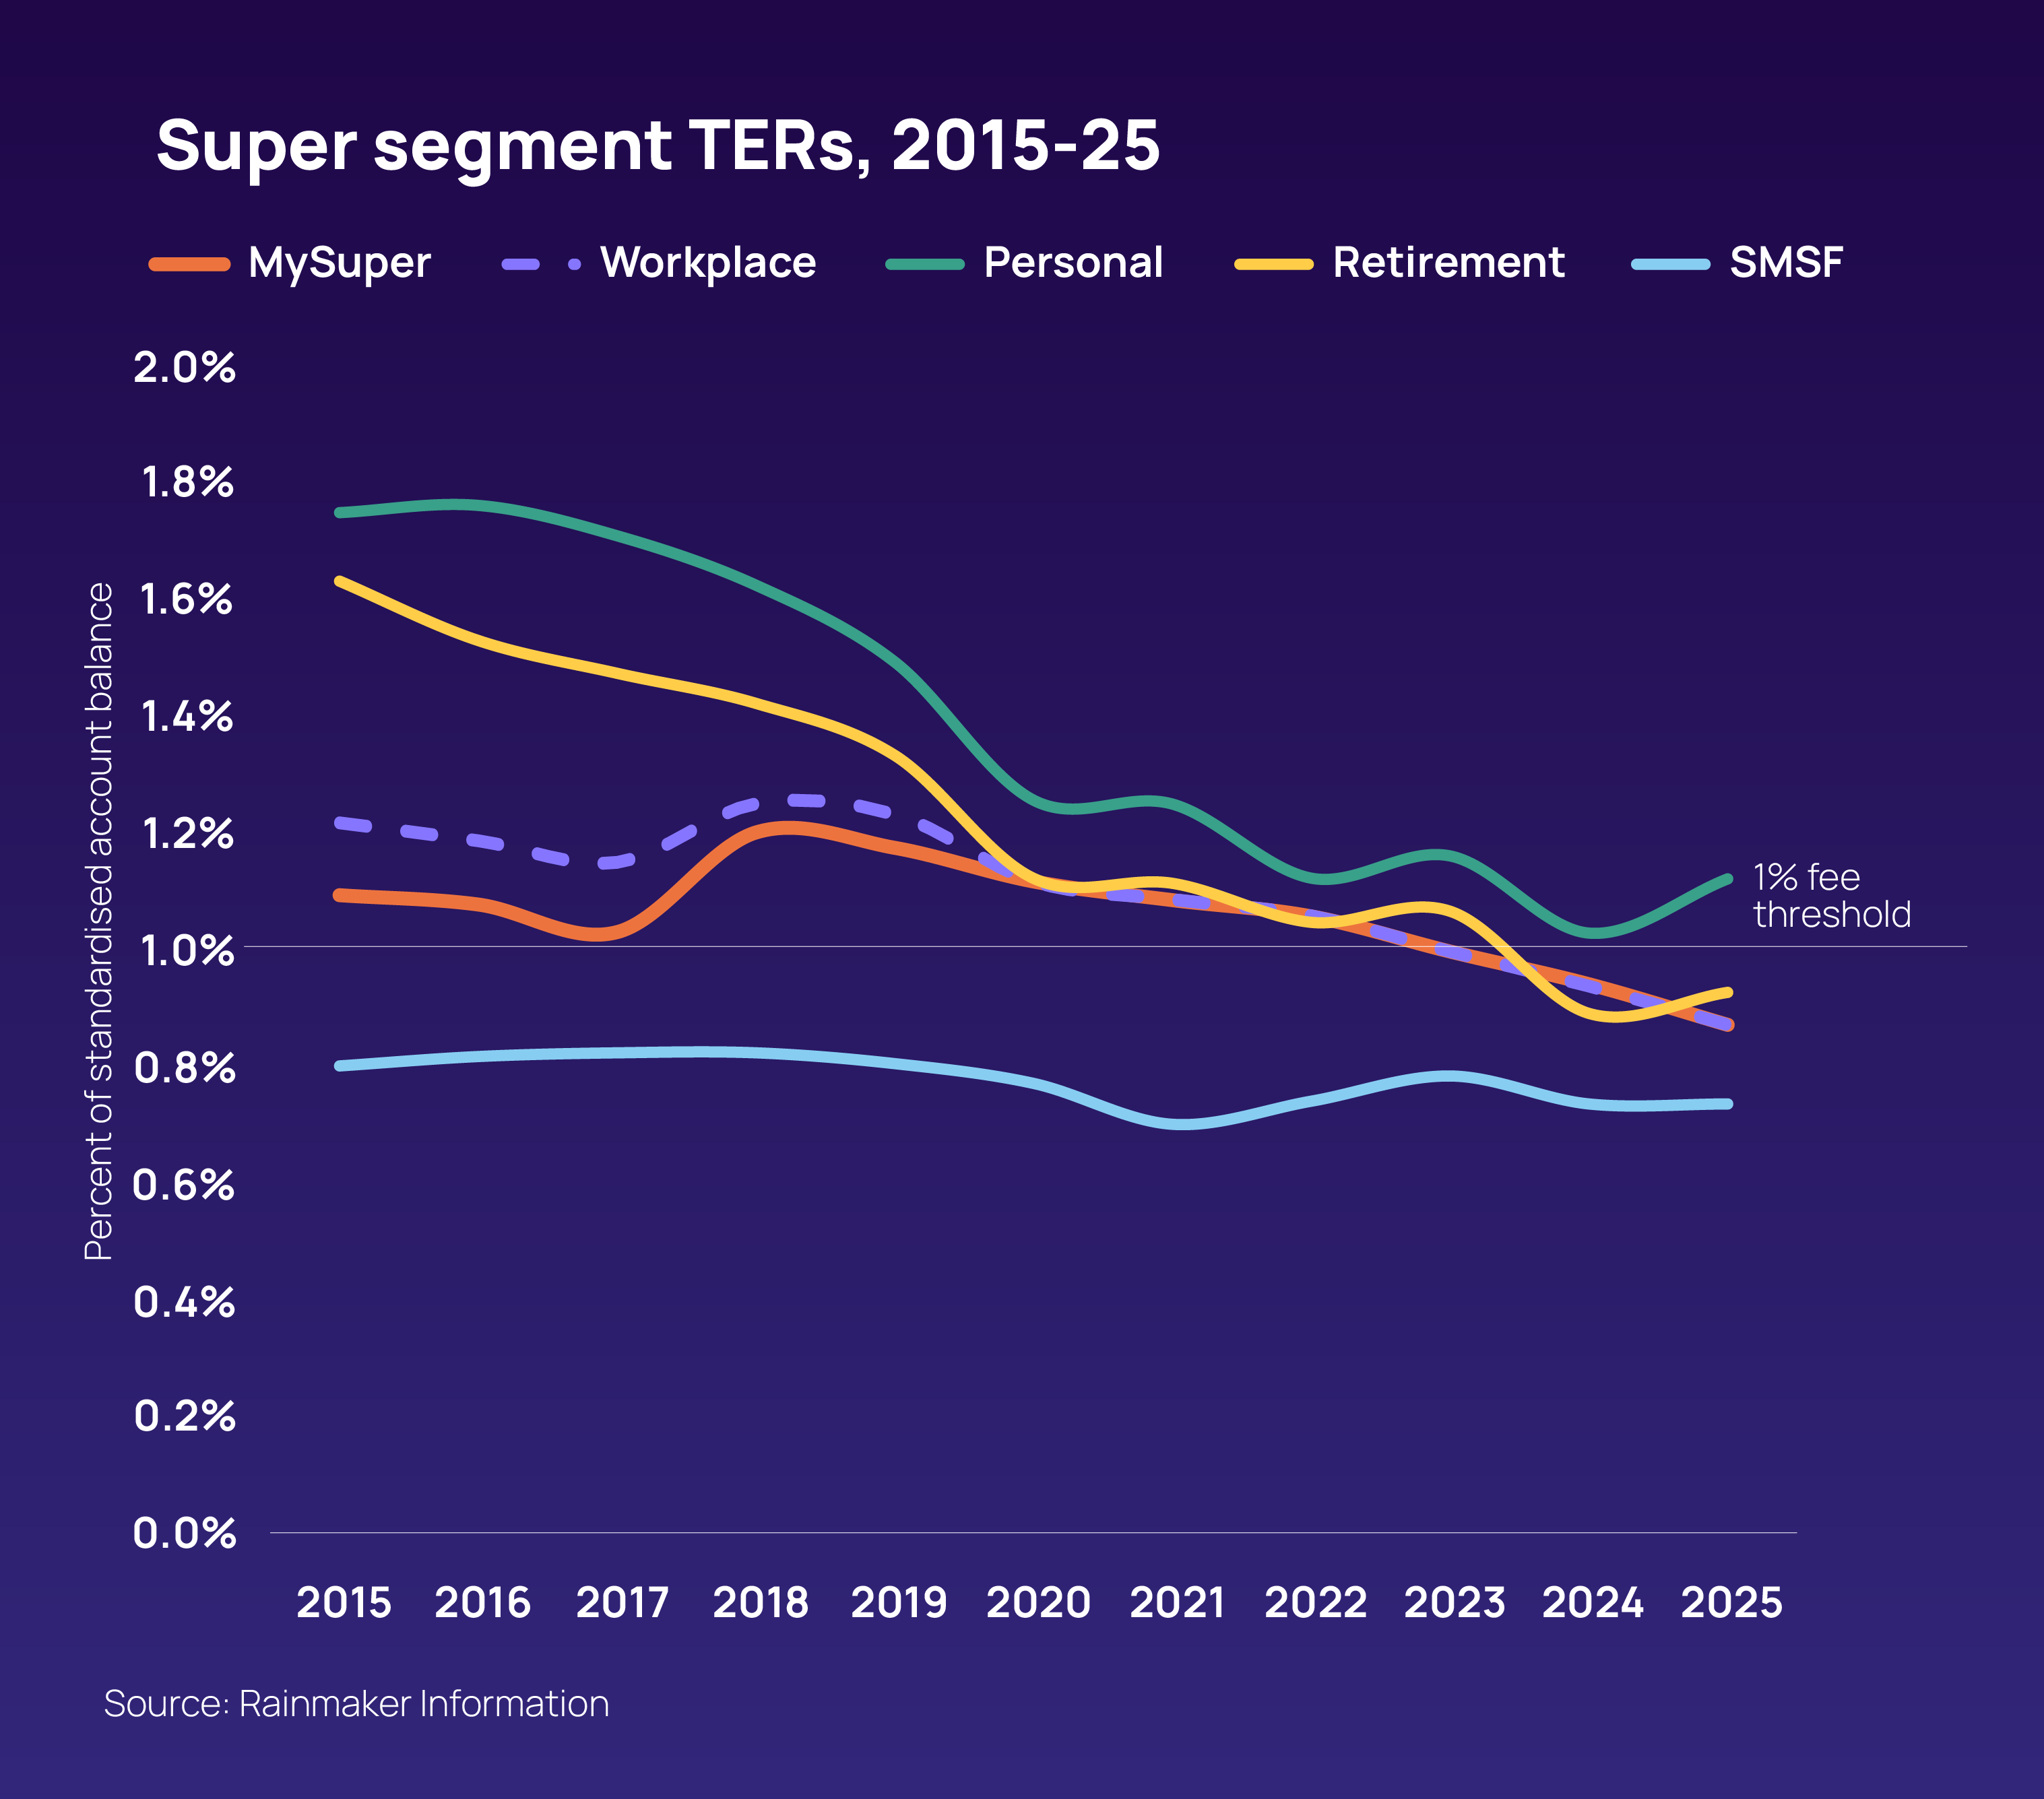
Superannuation fees fell for MySuper and workplace but went up for personal and retirement products.
Average MySuper fees fell for the seventh consecutive year, reducing by 0.07% to 0.87% pa.
Not-for-profit (NFP) MySuper products recorded an 8% drop in Total Expense Ratio (TER) to 0.85% pa, while retail MySuper products experienced a small increase of 2%, to a TER of 0.96% pa.
Default workplace super funds in FY2024-25 achieved average returns of 10.6%, topping the strong 9.3% return in 2023-24. Falling inflation meant this was eight percentage points above the inflation rate.
In real terms over 10 years, i.e. after inflation as measured by the CPI, super fund default options on average achieved investment outcomes of 4.5% pa.
The Retail MySuper index continued to outperform the NFP MySuper Index over 12 months, returning 11.6% versus 10.4%.
Over the 12-months to September, international equities continues to be the best performing option with a median return of 18.5%, although it under-performed its headline market index by 5.1 percentage points.
Over the past year, reported life insurance inflows were down by 1.7%. Year-on-year risk inflows, accounting for more than three quarters, or 77.5% of the total, decreased 0.8%. Retirement income Inflows fell by 2.1%, while those in the much smaller ordinary (non super) and individual and group super investment sub-markets dropped by 6.8%, 85.9% and 34.8% respectively.
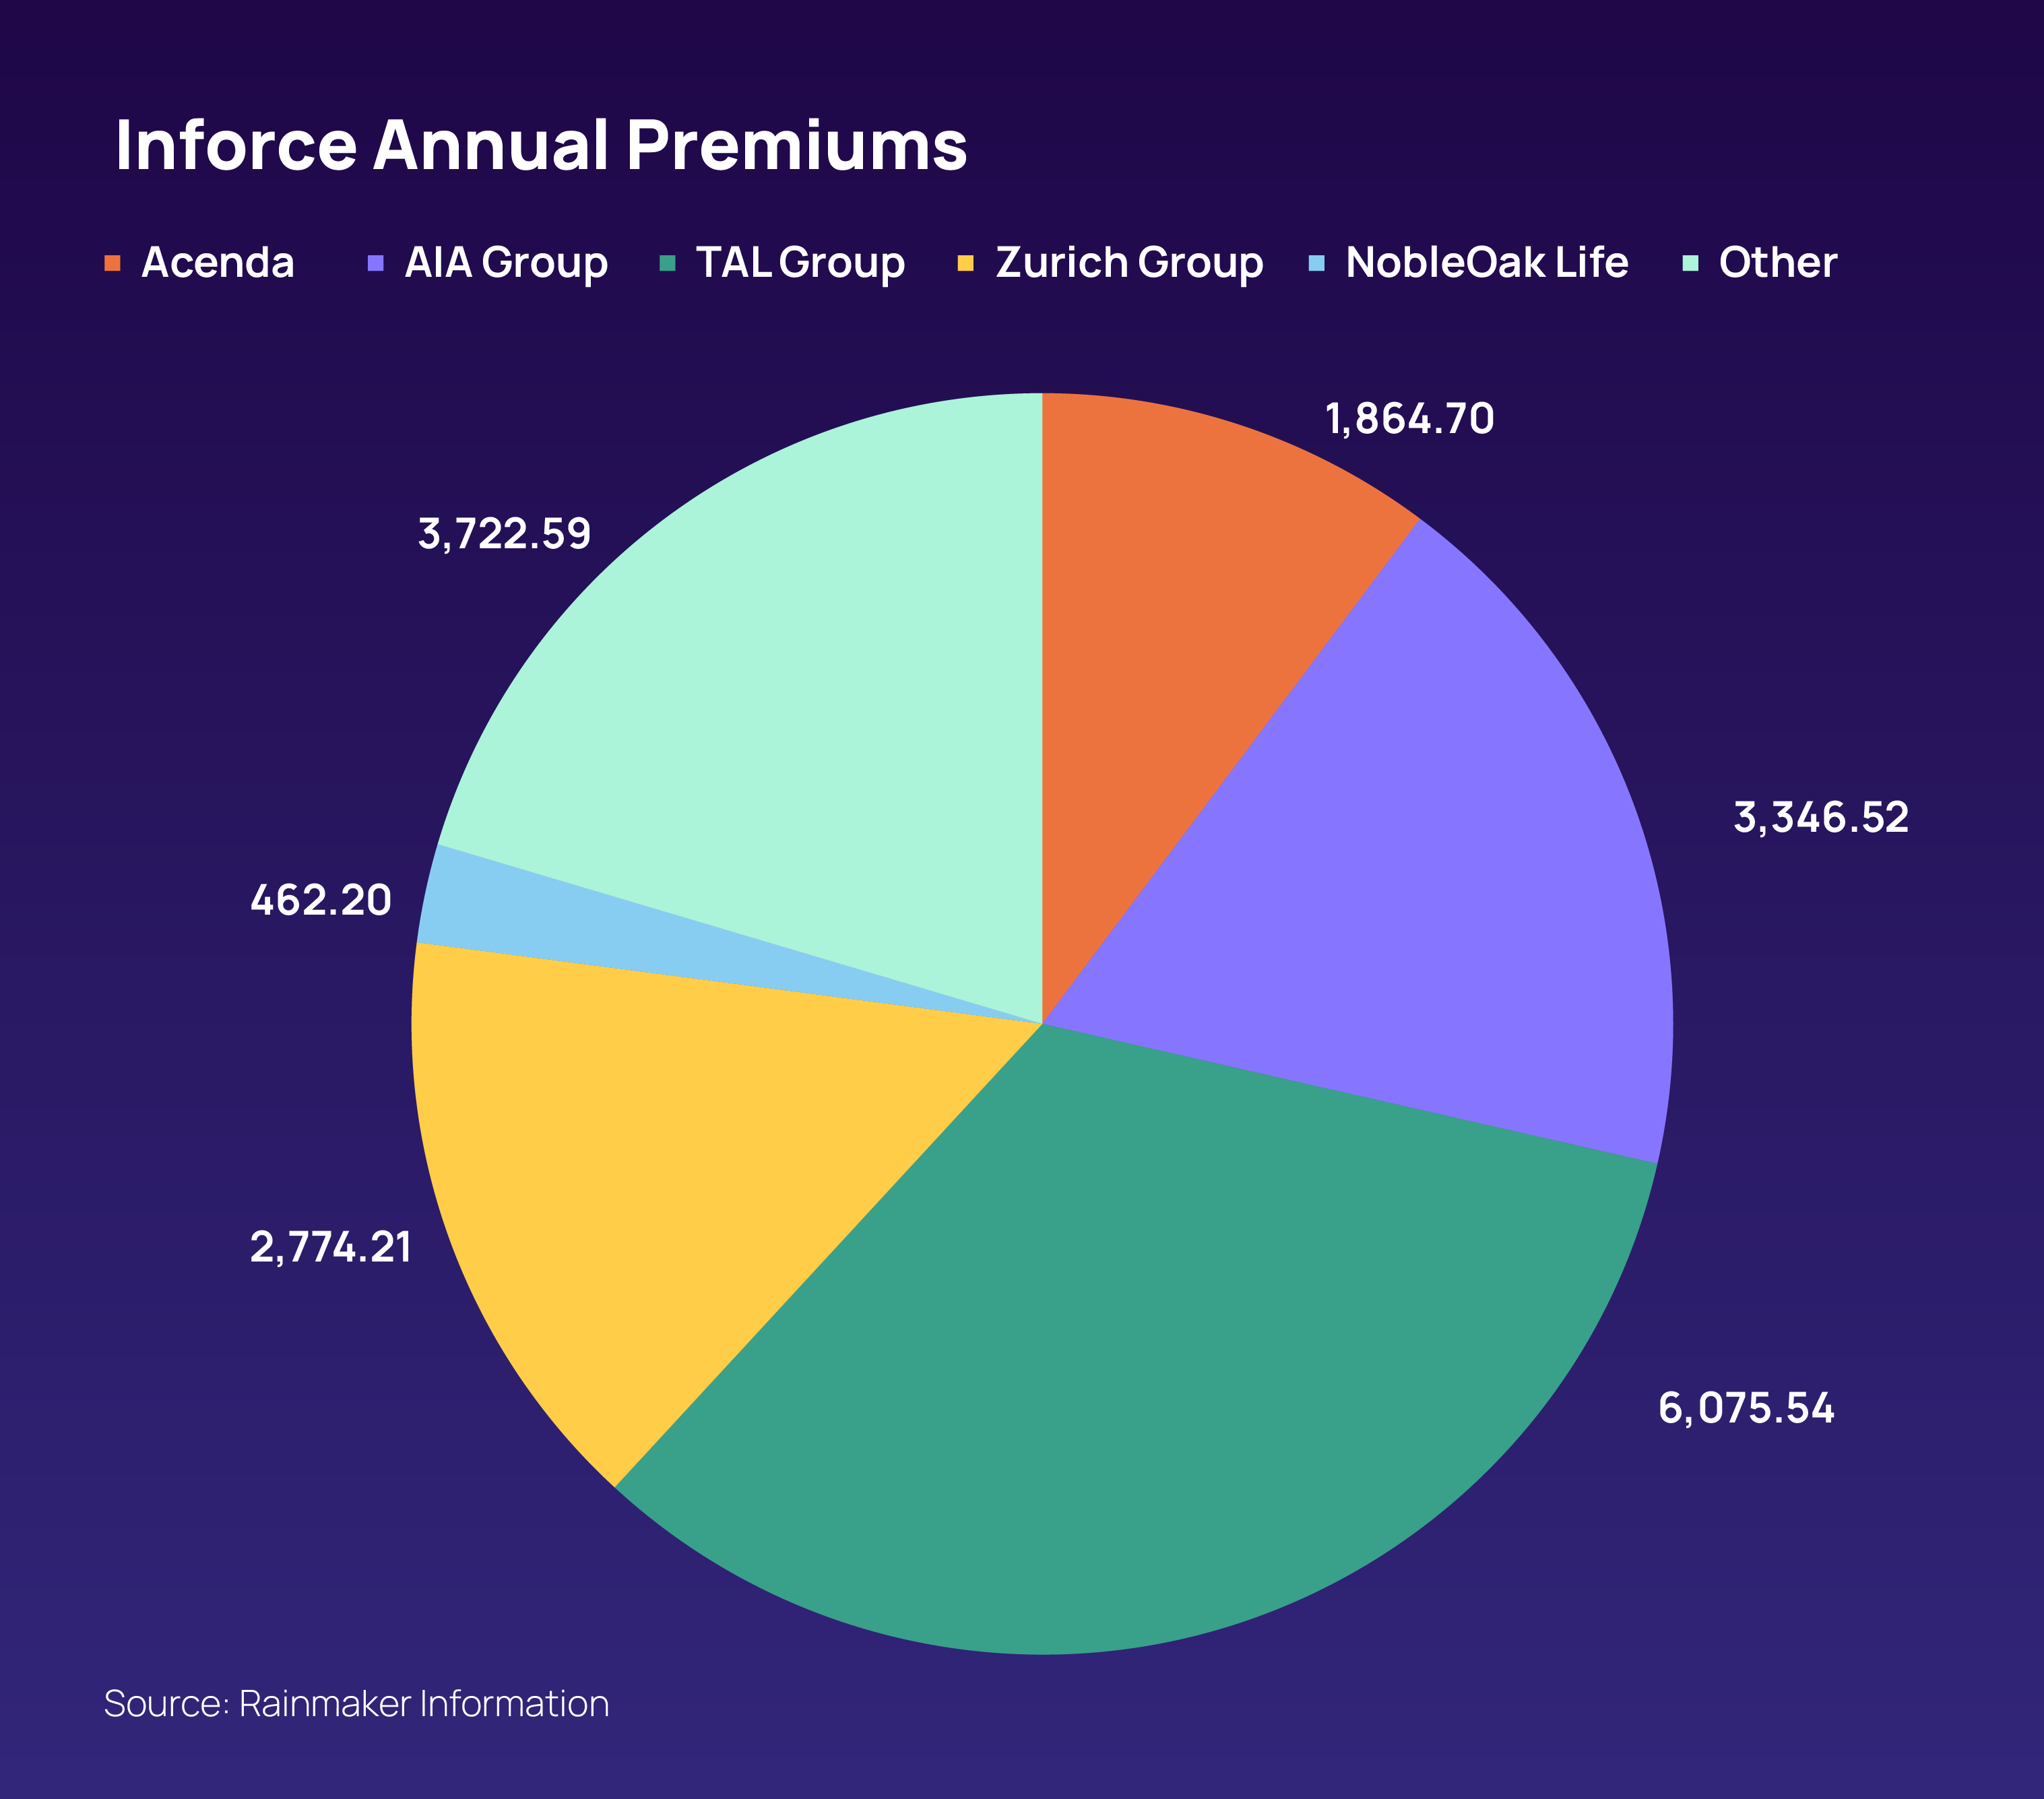
Market leader TAL (-3.1%) reported slightly lower annual inflows, while Challenger (-0.8%), AIA (-1.5%), Zurich (0.7%) and Acenda (-0.5%) finished with smaller changes.
Reported individual risk lump sum sales were also up by 1.2% over the past year. The two market leaders TAL (2.0%) and Zurich (2.5%) experienced slight rises year-on-year, those of AIA (-8.3%) and Acenda (-2.7%) were lower. By contrast, smaller players NobleOak (35.1%) and ClearView (13.2%) both reported significant double digit increases in their risk lump sum sales.
Direct life premiums fell by 7% since 2024. There was also a significant reduction in direct income protection premiums since 2024, with average premiums for waiting periods of 30 days and 90 days reducing by 12% and 13% respectively
The overall market average for lapses was up by 0.2% from last year to 10.5%. The average income protection cover lapse rates were highest at 17.2% followed by TPD cover rates (15.3%), trauma cover rates (13.2%) and death cover rates (12.6%). Market average lapse rates for funeral cover (4.7%) and accident cover (6.1%) were low, compared to CCI cover (12.5%).