.svg)

.png)
Total superannuation funds under management reached $4.4 trillion as at March 2026. The total assets in superannuation have grown by an impressive 118% over 10 years to March 2026, highlighting the strong long-term expansion of the system.
Growth across MySuper, Choice and retirement segments remain strong, while market concentration continues to increase, and platforms and managed accounts play an increasingly important role in how portfolios are constructed and delivered to members.
Regulatory scrutiny is intensifying with a greater focus on investment governance, transparency and delivering measurable outcomes across the member lifecycle, alongside continued shifts in asset allocation and the role of private markets within portfolios.
Anecdotally, large, digitally mature funds have indicated some improvements in engagement among younger members, but at a system level, there hasn’t been a fundamental shift.
The data we have indicates some engagement among younger members based on how often they check their balance, though this is only one aspect of engagement.
Specifically, Money magazine ran a survey called ‘Your Super, Your Say’ over Jan–Feb 2026, receiving 642 responses.
The caveat here is that the typical Money reader’s demographics may differ to the broader population and they may be more likely to be financially interested, though we found that the type of super fund Money readers are in i.e. Not-for-Profit, Retail or SMSF (62%/29%/9%) is comparable with the broader proportions evident in the APRA data as at December 2025 (72%/23%/5%).
The chart below summarises responses to the question “How often do you check your super balance?”.
The key takeaways are that:
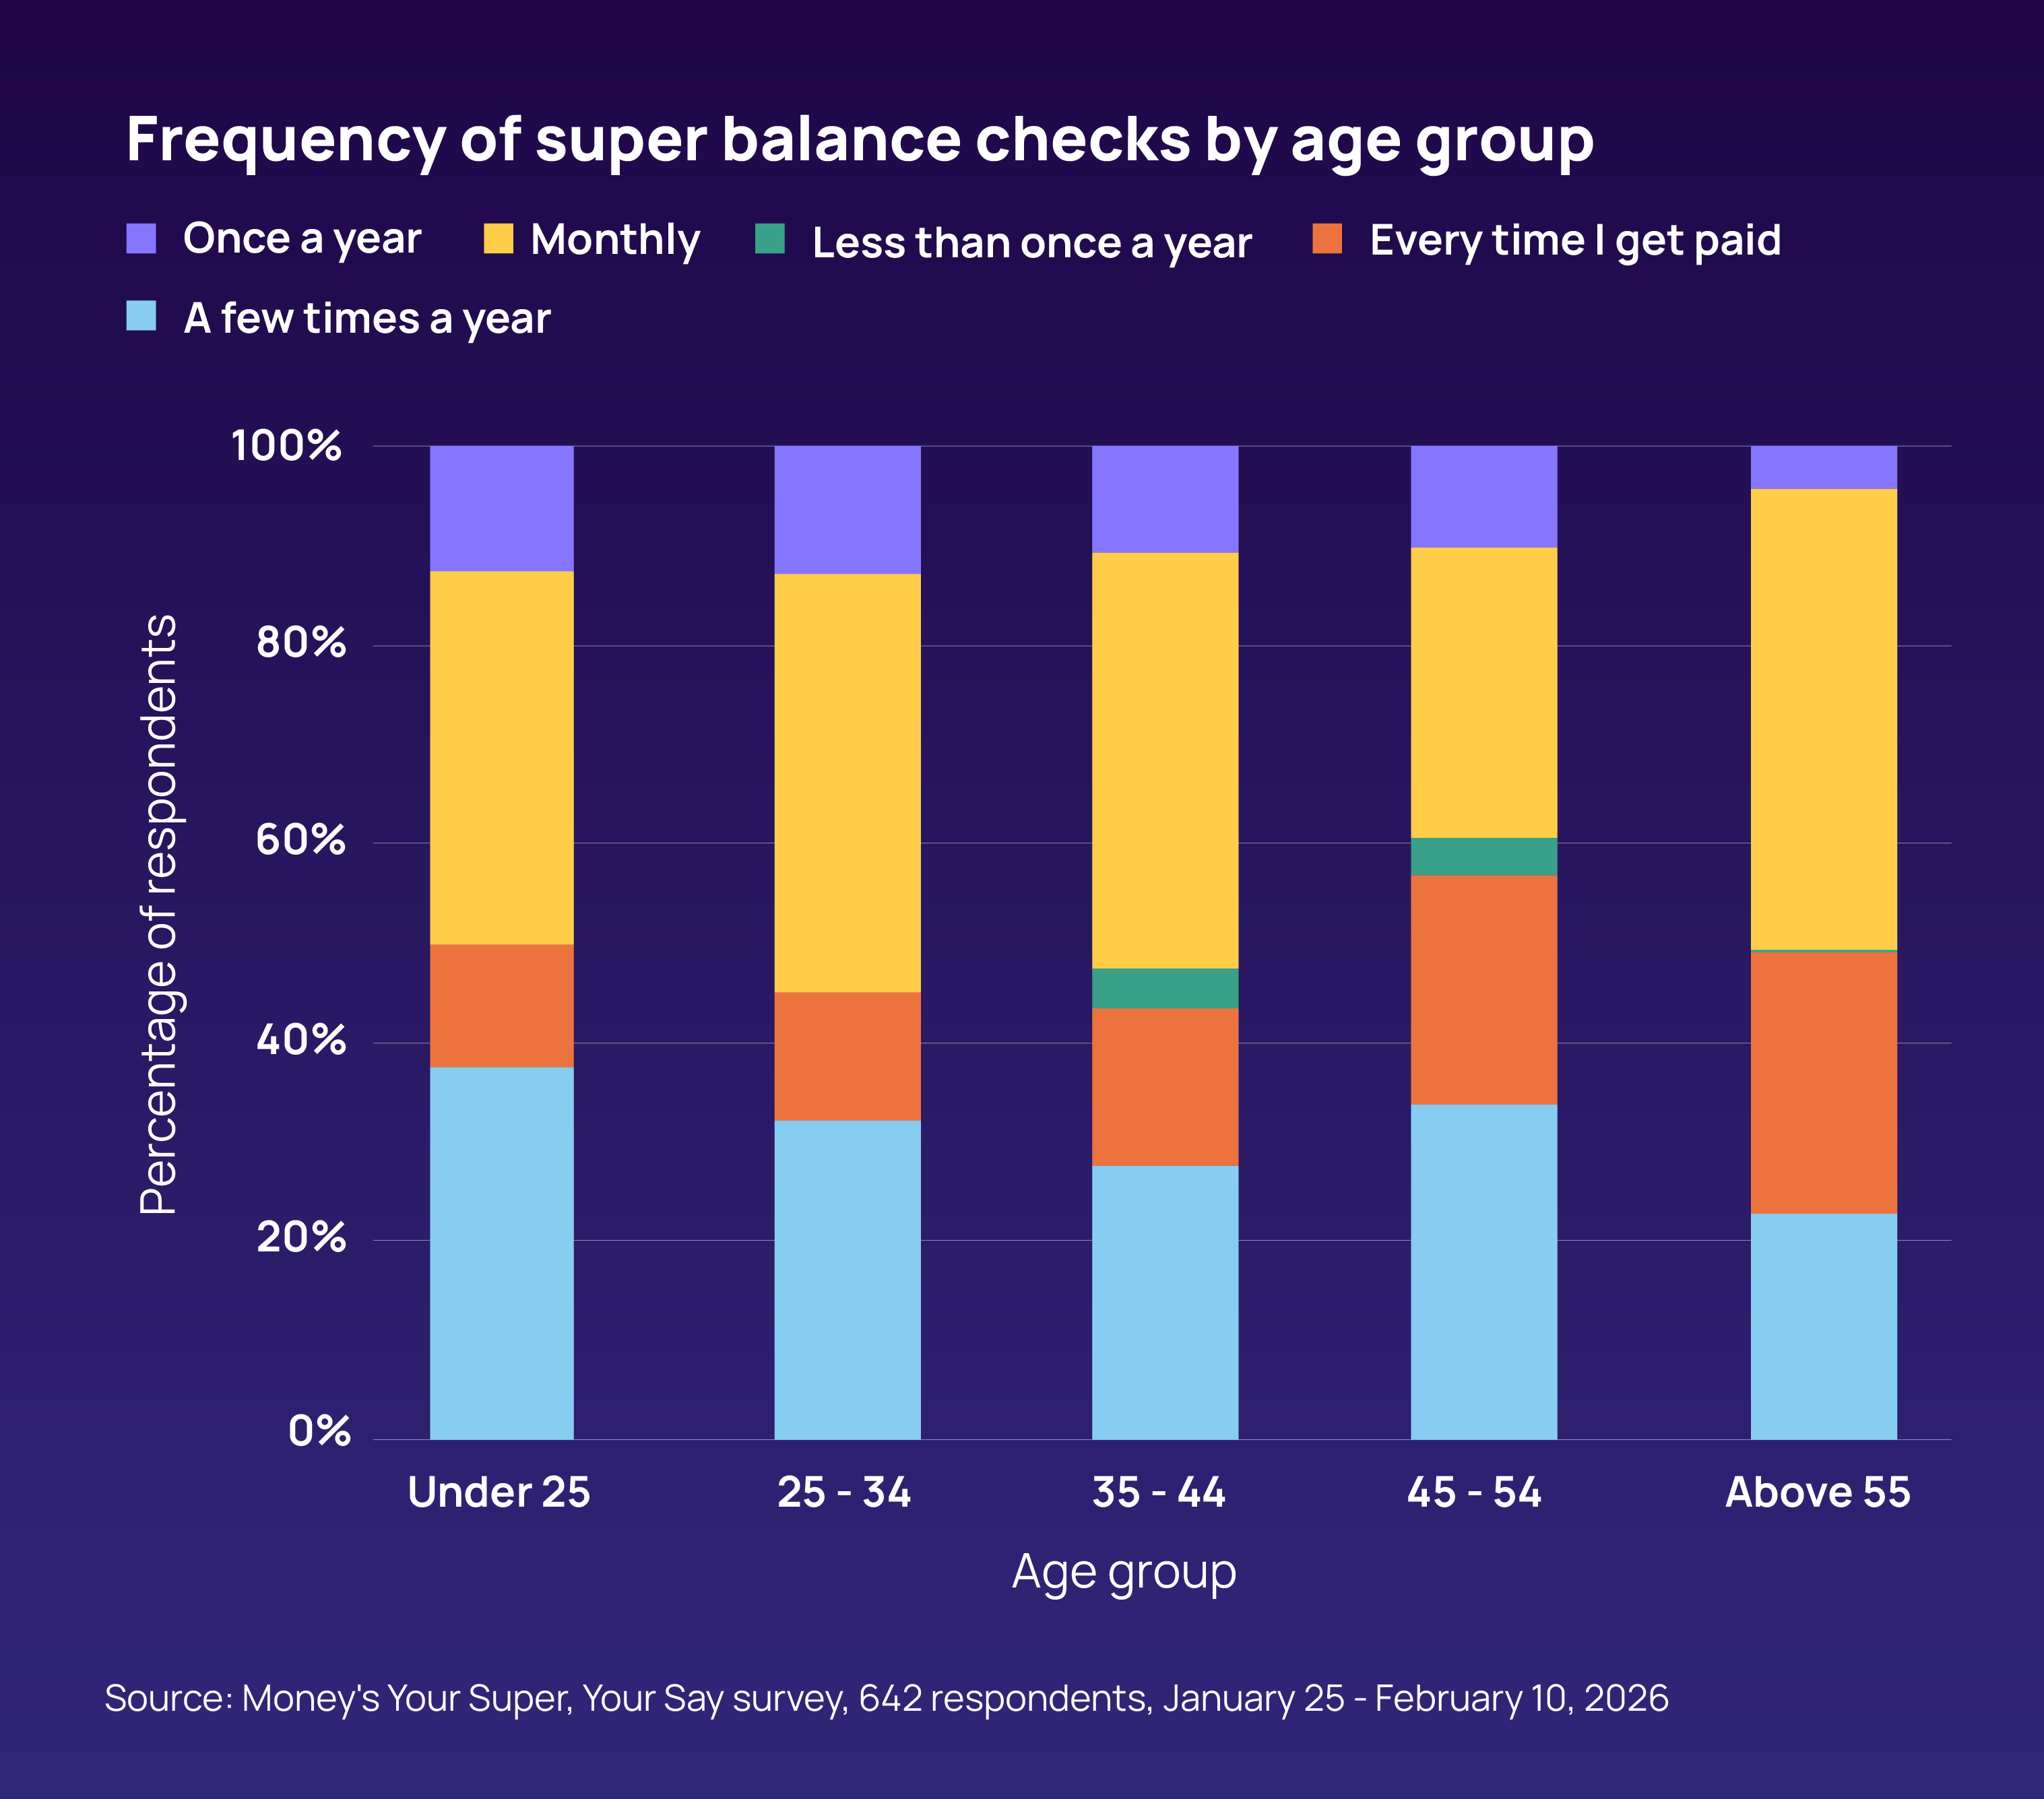
Evidently, there is some engagement among younger members but trigger-based engagement i.e. checking your balance every time you get paid, which is a stronger indicator of active engagement and financial salience still skews heavily toward older cohorts.
The introduction of Payday super is the key point to watch as the move to align contributions more closely with pay cycles has the potential to increase visibility of contributions and create a natural behavioural trigger to check balances, so we may see some uplift in the ‘check every time I get paid’ category across age groups.
The allocation to private and unlisted assets within superannuation portfolios has remained broadly stable over recent years.
Based on APRA data, these assets accounted for approximately 17% of total investments across APRA-regulated funds in June 2022, easing slightly to 16% by December 2025.
This modest decline occurred despite a significant increase in absolute holdings, which rose from $367 billion to $464 billion.
Over the same period, funds under management in private and unlisted assets increased by around 27%, compared with a 37% rise in total superannuation assets.
This indicates that while investment in private and unlisted assets has grown in dollar terms, it has not kept pace with the overall funds under management expansion.
Within the private markets segment, growth has been uneven.
Private debt and unlisted infrastructure have been the standout areas, with funds under management increasing by approximately 86% and 69% respectively.
Read blog post: Super funds' allocation to private assets continues to grow
Lengthy TPD claim times are driven by a combination of factors including the fragmented process across trustees, insurers and administrators.
TPD assessments are complex and forward-looking, requiring insurers to determine not just current incapacity but whether a member is unlikely to ever work again, often based on an ‘any occupation’ definition which is a higher threshold to meet than an ‘own occupation’ definition.
To undertake this assessment, insurers rely on medical evidence and missing or incomplete medical reports are a common reason for delays as insurers will request additional documentation if reports are unclear or insufficient. Inconsistent medical opinions or the need for independent medical examinations also adds to the process.
Super funds’ administrative practices can also contribute meaningfully to TPD claim delays through several compounding factors: paper-heavy processes, friction at the fund-insurer hand-off point, sequential rather than concurrent information gathering, trustee decision-making lags, and poor member communication.
Delays can also be compounded by claimant-specific factors such as low engagement and complex work or health histories.
Insurer requirements at claim time do contribute, particularly through high evidentiary thresholds, staged information requests, and the need for defensible decisions in a litigious environment but these are largely a response to the complexity of the product.
This is a nuanced question that depends on what ‘better’ or ‘safer’ means, and how ‘government-run super fund’ is defined, as well as the type of superannuation entitlement i.e. accumulation or defined benefit.
All APRA-regulated superannuation funds irrespective of whether they are government, industry, or retail funds operate under the same SIS Act obligations, prudential standards and member outcomes requirements.
There is no separate safety tier for government funds.
It is important to note that the term government fund can refer to different types of funds:
Superannuation funds in Australia do not carry a government deposit guarantee equivalent to the Financial Claims Scheme that covers bank deposits up to $250,000. This applies to all fund types.

